
What you get
- One filter row for everything: which projects, and which time range.
- Five tabs, each answering one question, instead of one long page you scroll through.
- Charts from real day-by-day data. Archived tasks are counted too, so moving old work into the archive does not make your history shrink.
- Every figure next to the previous period of the same length, so you see whether things move up or down.
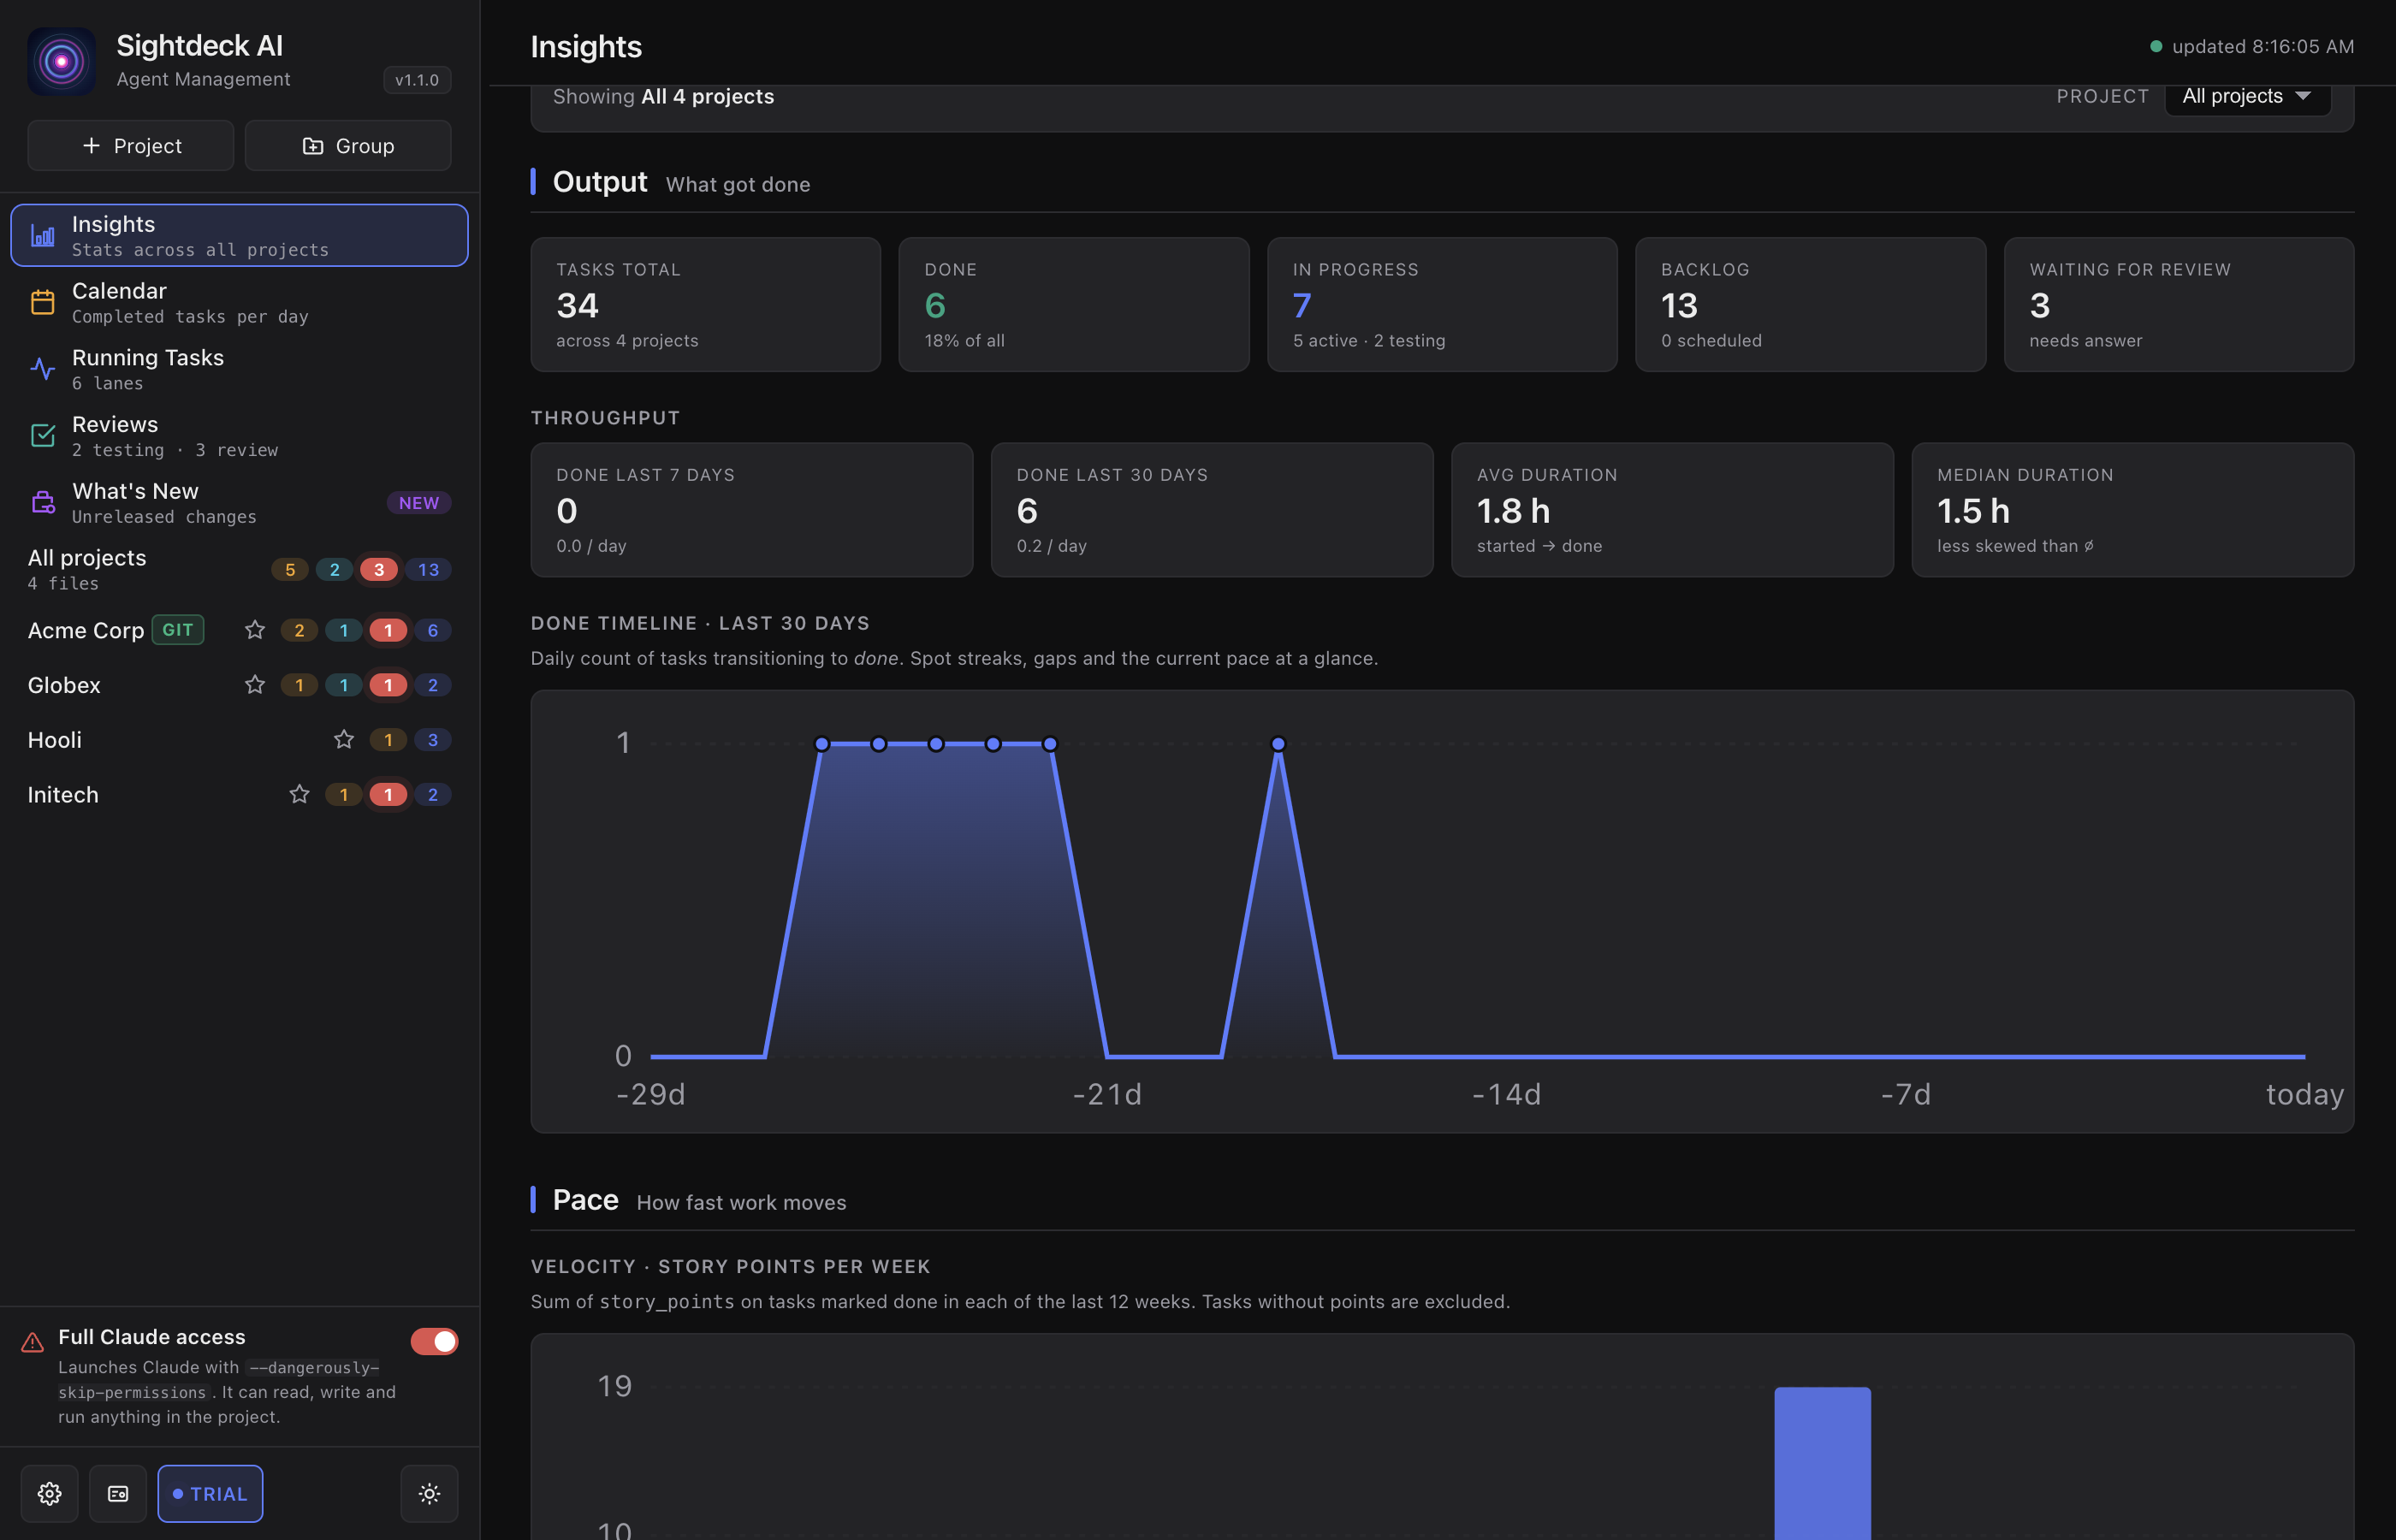
How you use it
- In the sidebar, under Reports, click Insights.
- Pick the projects: all of them for a portfolio view, or a single project for its own numbers.
- Pick the Range: Today, Yesterday, 7 days, 30 days, 90 days, This month, All, or Custom with a from and to date and Apply.
- Switch between the tabs.
The five tabs
- Overview — the four headline figures (tickets closed, cost, tokens per ticket, runtime), plus one chart from each of the other tabs. A glance answers "how is it going".
- Spend — tokens and cost over time, and per project. The token chart switches between Day, Week and Month.
- Pace — throughput, velocity, how long tickets take per Story Point and how the estimates held up.
- Story Points — how each Story Point really spends its time: whether a lower Story Point really is the faster one, and which tier keeps stopping to ask you.
- Open — tasks that have been sitting in a state for too long, and the release health of your versions. The tab carries a count of what is still in flight.
Release health
On the Open tab, one row per managed version of the project: its state, how much of it is done, and — for the case where everything shipped but nobody ticked the flag — a Mark as released button that fixes it on the spot. Released versions are listed next to it.
The planned dates themselves live in Edit project → Versions; how the warning reaches you is on the Roadmap & versions page.
What Sightdeck records
Under Settings → Insights you decide what is recorded while the agent works. Everything stays on this machine and in the project.
- Show progress, active file & ETA on running tasks — see Live Progress & ETA.
- Record Profiler data for every run — times every tool call of a run, so the Profiler can show where a task's time went. On by default; switching it off stops new recordings, runs already recorded are kept.
这个页面对你有帮助吗?
谢谢,已记录。