
What you get
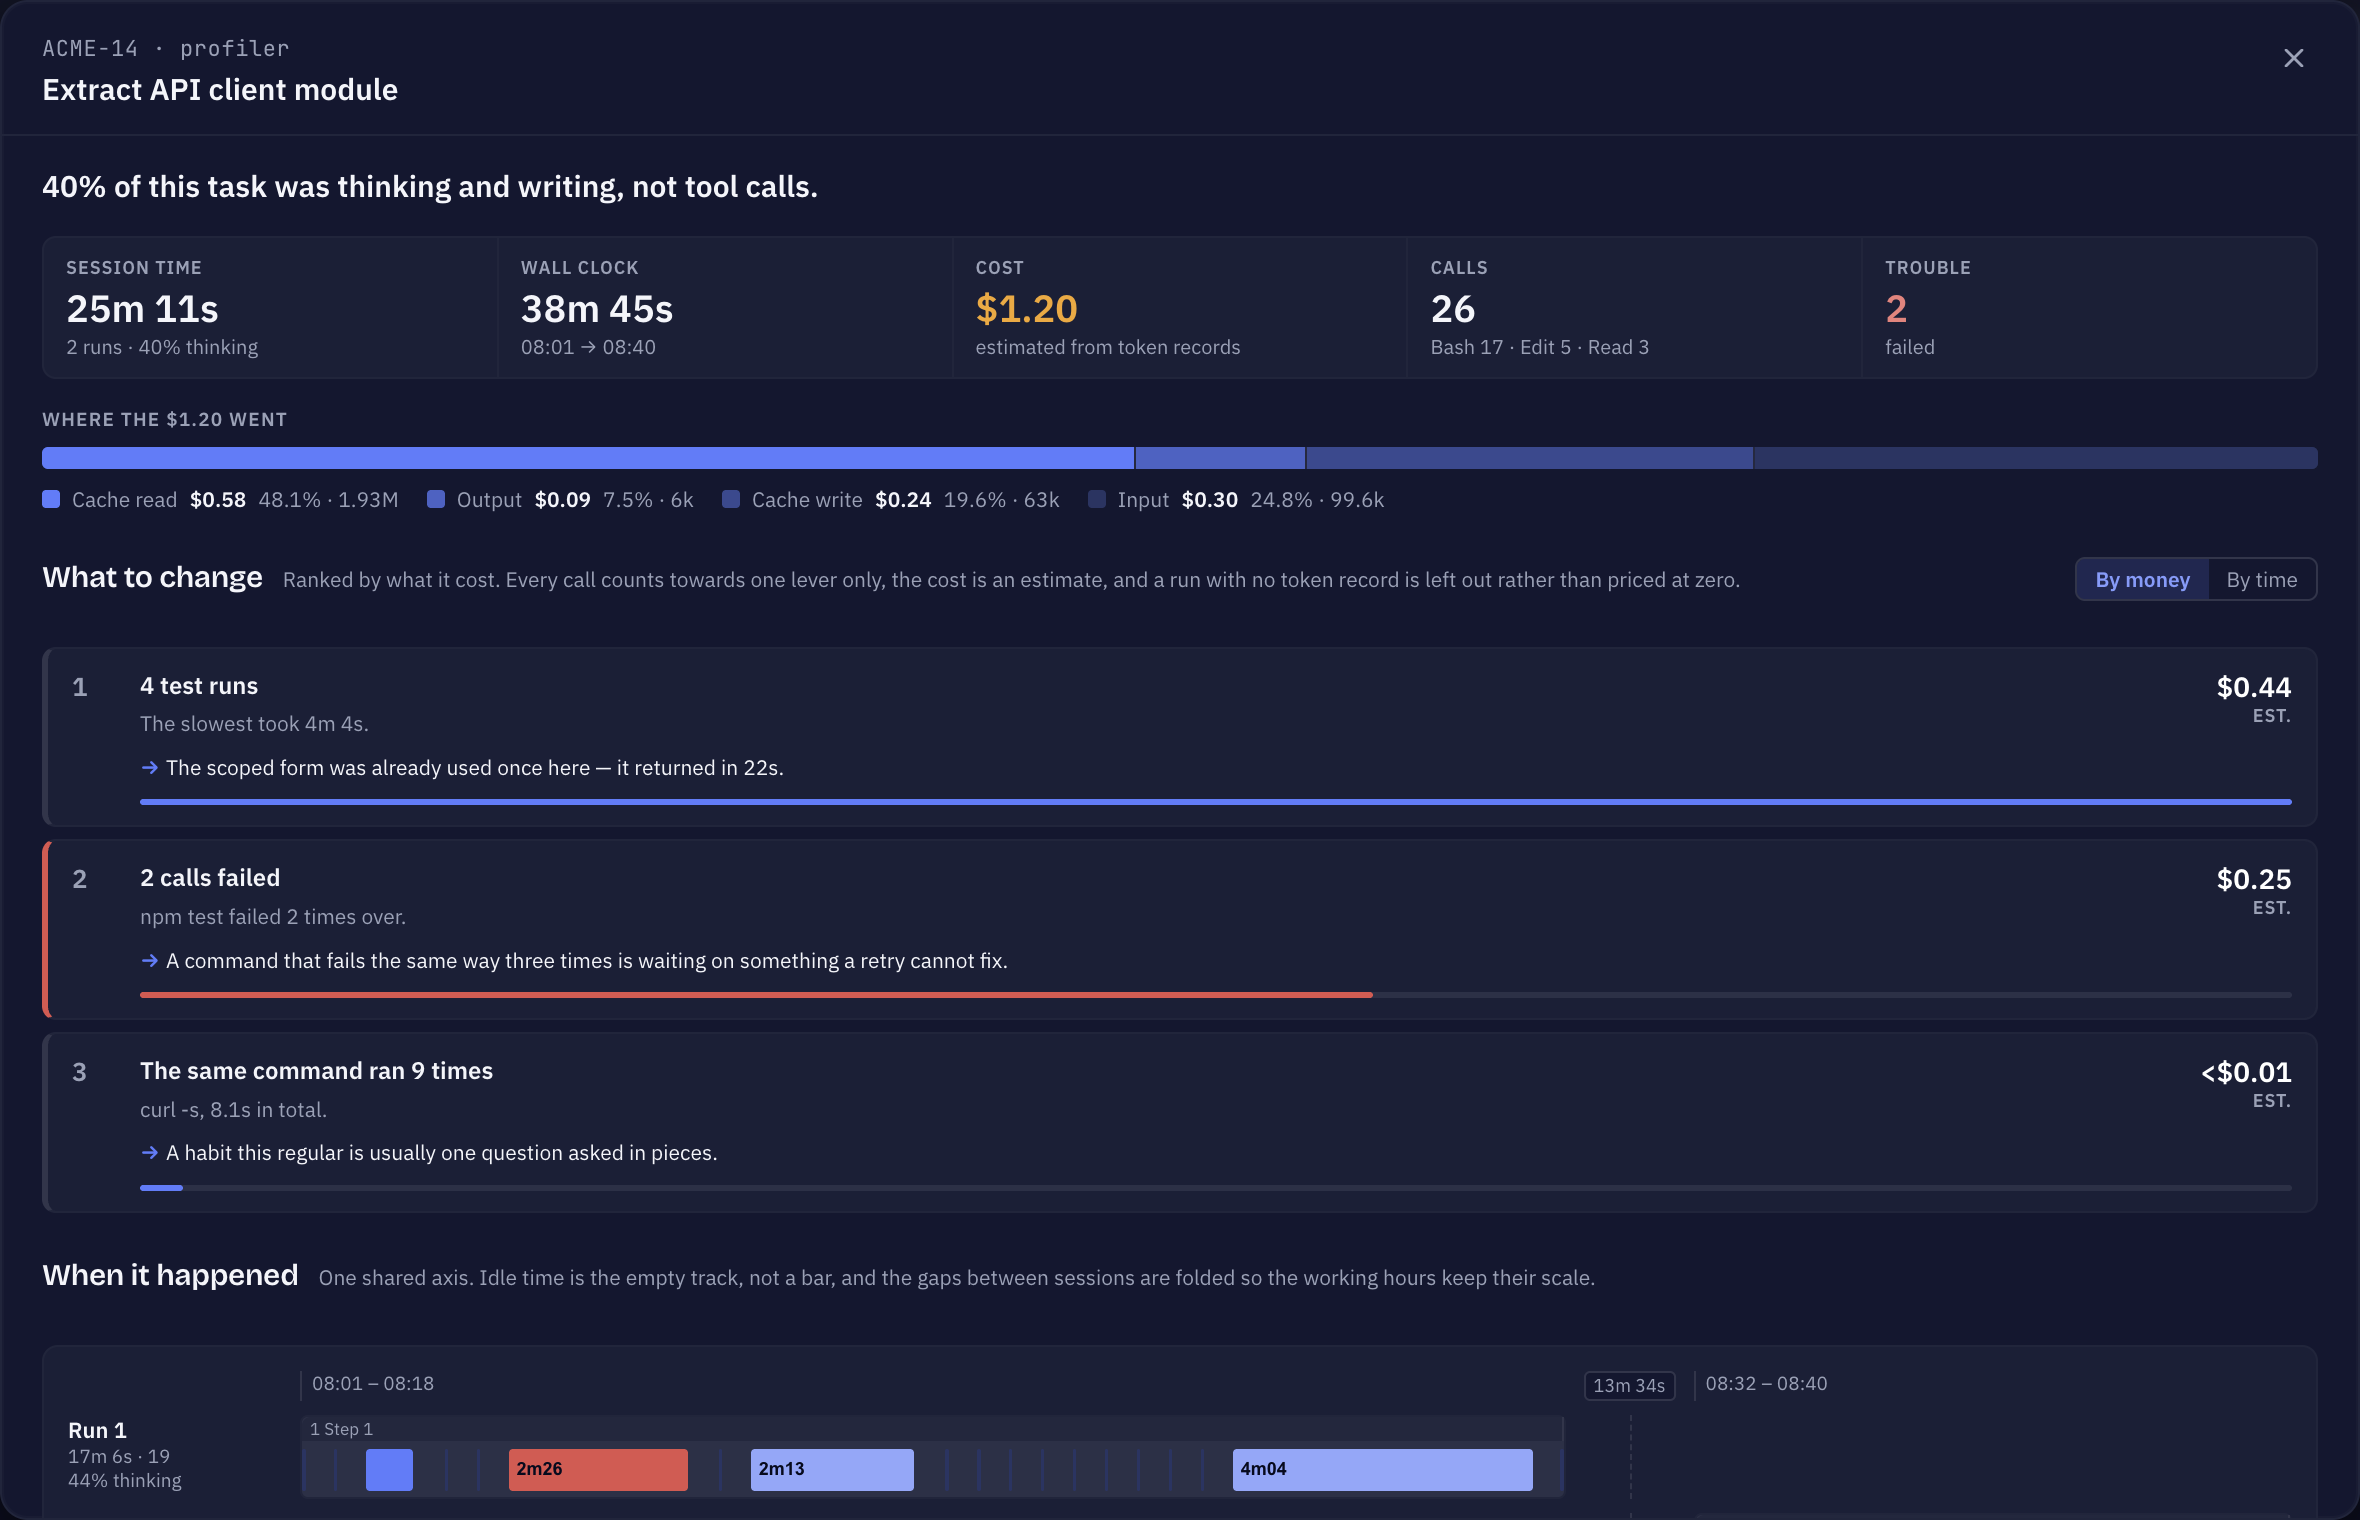
- Headline numbers for the task: Wall clock, Session time (with the share spent thinking), Calls, Cost and Trouble (failed calls and calls that never closed).
- When it happened — all runs on one shared time axis.
- Where the money went — the cost split into input, output, cache read and cache write.
- What to change — concrete suggestions, ranked by what they cost.
- The calls — every call, grouped by command shape, with filters and a search.
How you open it
Open a task and press Profiler in the actions at the top of the task details. Its tooltip already sums it up, for example “12m of tool time in 84 calls across 2 runs”. A task without recorded timings says so in the tooltip.
Reading the timeline
Each run is its own lane on one shared axis. Calls are coloured by how long they took (under 1s up to over 2m), failed and never-closed calls stand out. Idle time is the empty track, not a bar, and long gaps between sessions are folded out so the working hours keep their scale. If two sessions worked on the task at the same time, the Profiler says which runs overlap.
A short verdict sums up the pattern, for example “72% of this task was thinking and writing, not tool calls” or “40% of the bill was spent re-reading context, not doing the work”.
What held it up, and what to change
What to change lists what stood out, each with the evidence and a suggestion. Every call counts toward one suggestion only, and the cost is an estimate. Typical findings:
- the same command ran many times — usually one question asked in pieces;
- many calls only read a file through the shell, each one a turn that re-sends the whole context;
- several full test runs, where a scoped spec would have answered faster;
- calls that failed the same way again and again, or never closed;
- a run that spent most of its time thinking rather than in tools;
- a run with no token record, or a model with no known price, so its cost is unknown.
If nothing stood out, it says so.
The calls
Calls are grouped by command shape — the same search run 38 times is one habit, not 38 findings. Open a group to see the single calls with their run and step. Sort By time or By money, filter All, Over 5s, File reads or Failed or open, and narrow the list with Filter commands.
How exact the numbers are
Time per tool is measured. Cost is measured per run and split across phases by their share of the run — an attribution, not a measurement. Very old runs may be rotated out; their totals still count, their timelines are gone.
The timings are recorded with Sightdeck’s hooks while a Claude Code session works. Providers without those hooks, such as Codex, record no tool timings, so their tasks show no timeline. The timings file stays on your computer and is not shared through git: a teammate opening the same task sees its totals but not your run detail.
Switching recording off
Recording is on by default. Under Settings → Insights, Record Profiler data for every run switches it off for every project. Only a short digest of what each call worked on is stored, never the full command or file. Turning it off stops new recordings; runs already recorded are kept and the Profiler still opens on them. For totals across tasks and projects, see Insights and Token cost tracking.