
What you get
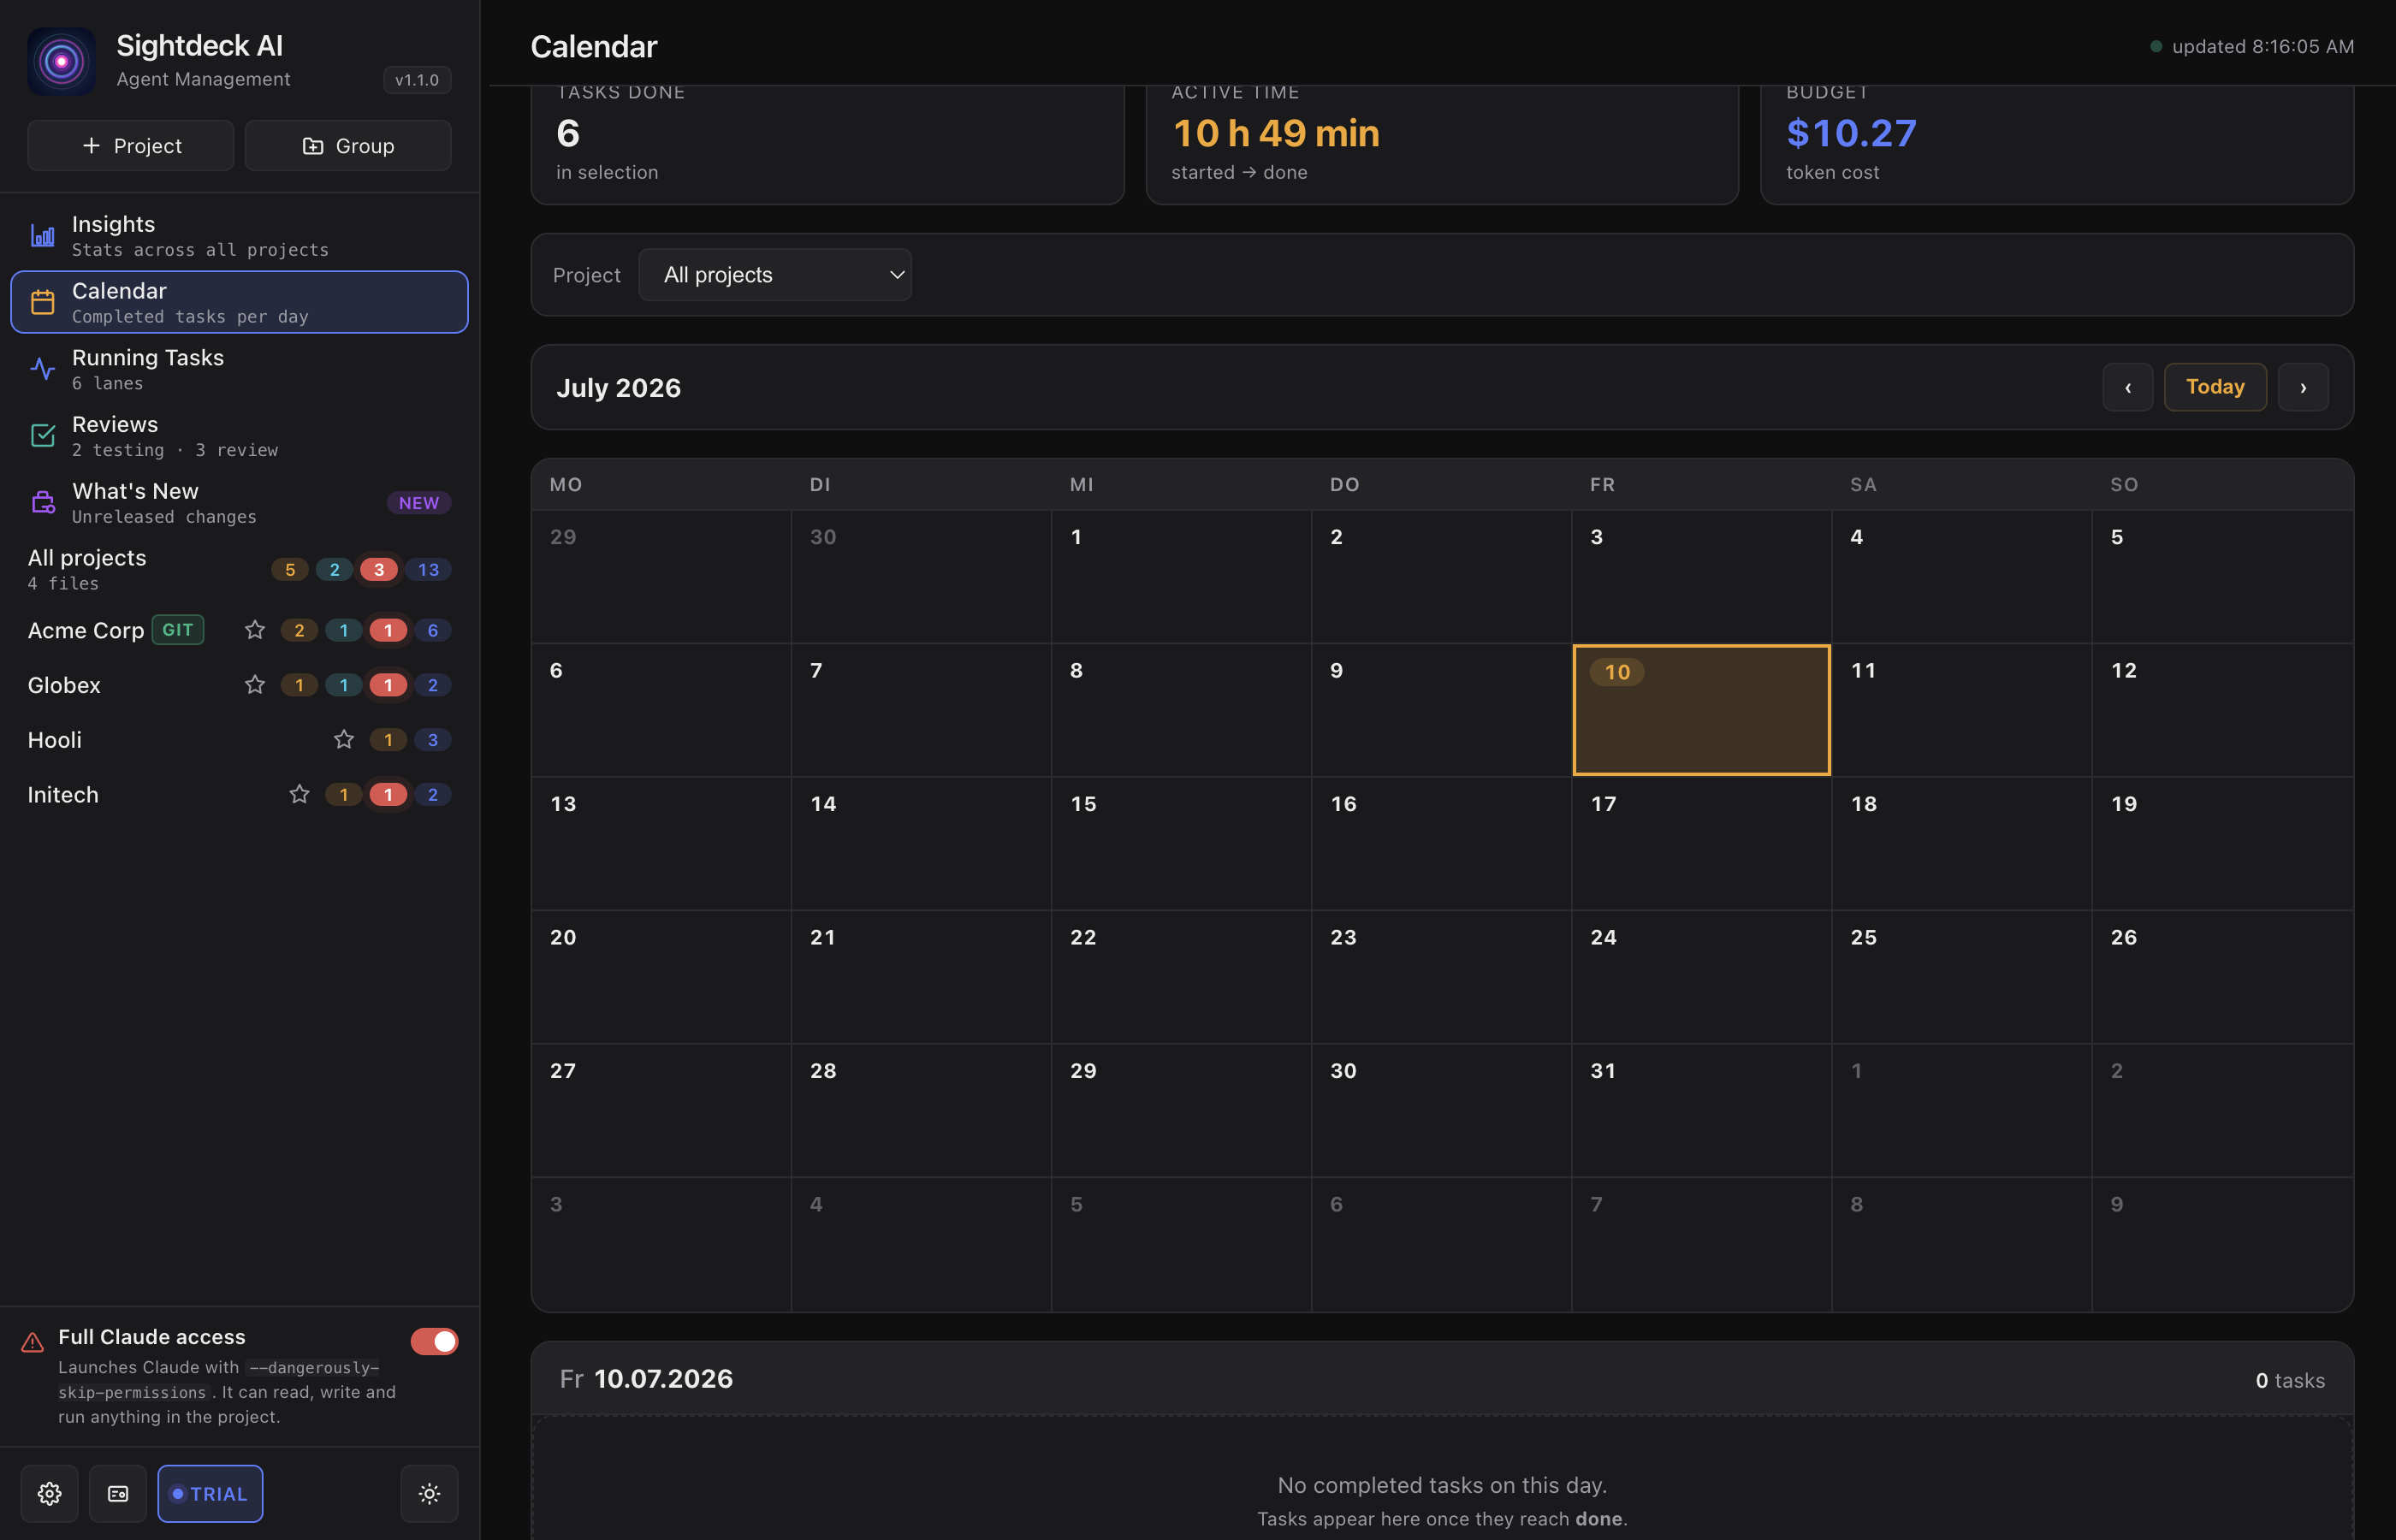
- A monthly grid showing how many tasks you finished each day — spot your productive days.
- Token cost per day at a glance — see which days were expensive (long-running or complex tasks).
- Expand any day to see the task list with individual active time and cost — drill in to understand where time and tokens went.
- Scope by project — view calendar for one project or all projects at once.
How you use it
- In the left sidebar, click Calendar (top group).
- Use the Project dropdown to view one project or All projects.
- The monthly grid shows completed task counts and cost per day. Darker cells mean more activity or higher cost.
- Click any day to expand and see the full task list for that day, including each task's active time and cost.
- Use the month/year arrows to navigate between months.
Use cases
- Track velocity. How many tasks finish per day? Are you getting faster?
- Spot cost spikes. Which days had unexpectedly high token usage? Investigate what happened.
- Understand task complexity. Some days show few tasks but high cost — those are complex, long-running tasks.
- Portfolio visibility. In All projects mode, see aggregate productivity across your entire workload.